Control Systems
Frequency Domain Analysis
Bode Plot
Questions mapped to Bode Plot under Frequency Domain Analysis.
21
Total0
Attempted0
Correct0
IncorrectThe asymptotic Bode magnitude plot of a system is shown
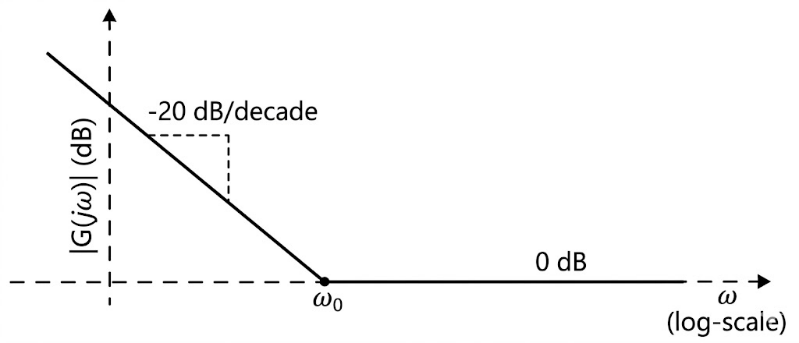
Which one of the following options best represents the transfer function of the system?




Sign in to see the solution
Log in to view the explanation, track your attempts, and keep your progress.
Sign in to UnlockConsider the stable closed-loop system shown in the figure. The asymptotic Bode magnitude plot of has a constant slope of decade at least till with the gain crossover frequency being . The asymptotic Bode phase plot remains constant at at least till . The steady-state error of the closed-loop system for a unit ramp input is ________ (rounded off to 2 decimal places).





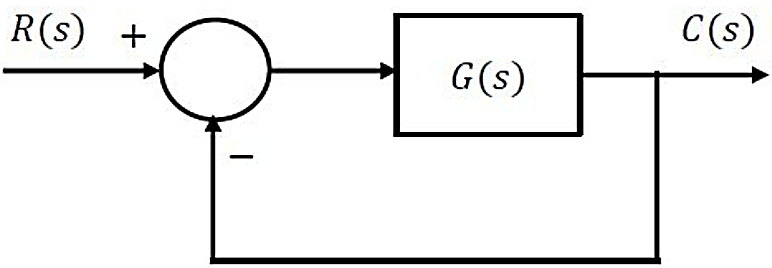
Sign in to see the solution
Log in to view the explanation, track your attempts, and keep your progress.
Sign in to UnlockThe magnitude and phase plots of an LTI system are shown in the figure. The transfer function of the system is
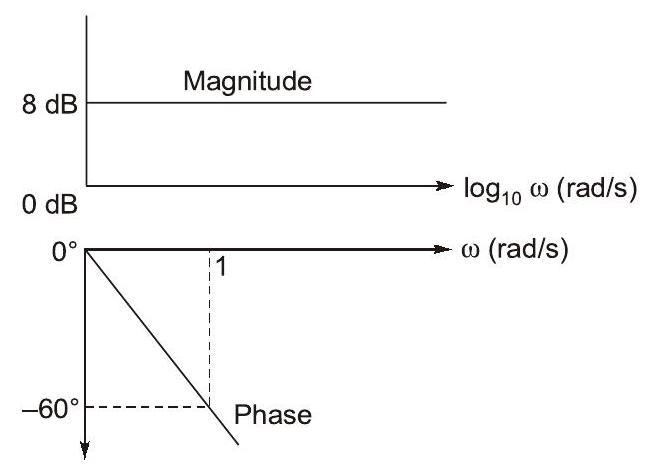




Sign in to see the solution
Log in to view the explanation, track your attempts, and keep your progress.
Sign in to UnlockThe Bode magnitude plot of a first order stable system is constant with frequency. The asymptotic value of the high frequency phase, for the system, is −180°. This system has

Sign in to see the solution
Log in to view the explanation, track your attempts, and keep your progress.
Sign in to UnlockThe Bode magnitude plot for the transfer function of the circuit is as shown. The value of R is _______ Ω. (Round off to 2 decimal places.)

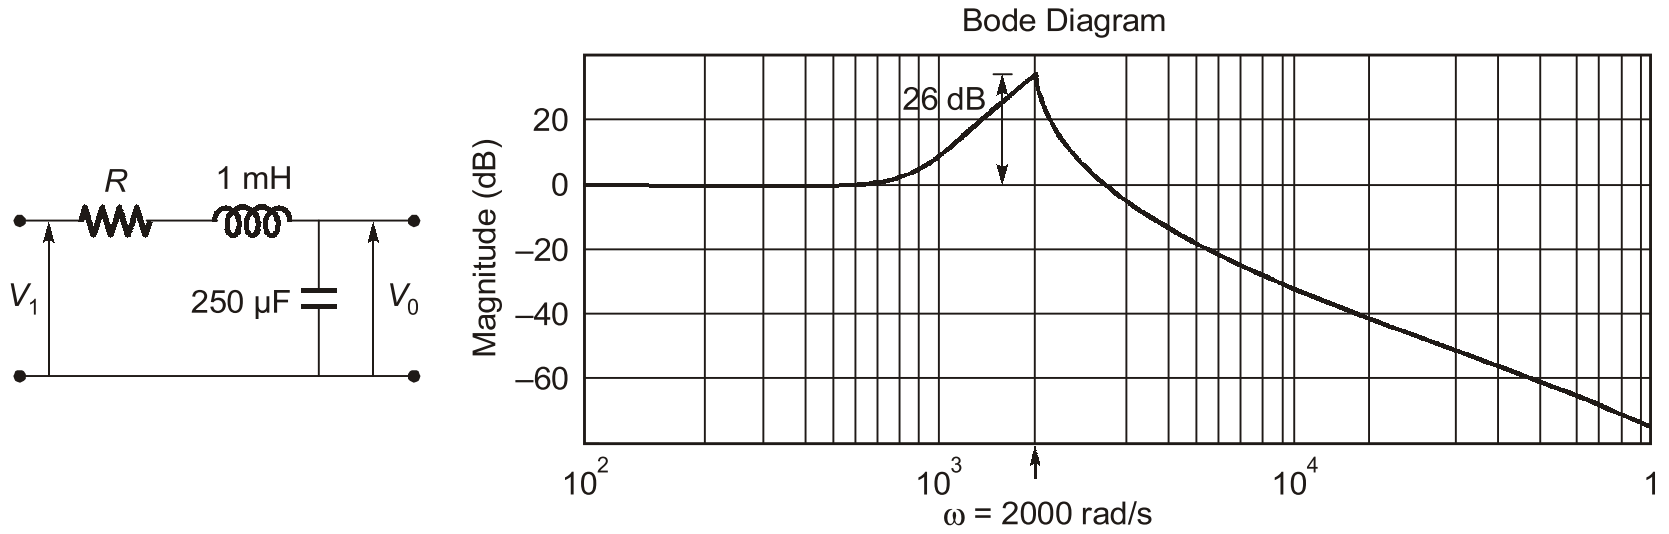
Sign in to see the solution
Log in to view the explanation, track your attempts, and keep your progress.
Sign in to UnlockThe asymptotic Bode magnitude plot of a minimum phase transfer function G(s) is shown below.
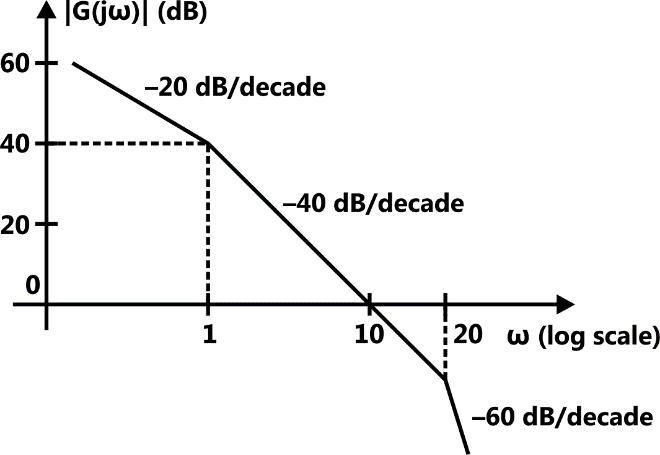
Consider the following two statements.
Statement I: Transfer function G(s) has three poles and one zero.
Statement II: At very high frequency , the phase angle


Which one of the following options is correct?
Sign in to see the solution
Log in to view the explanation, track your attempts, and keep your progress.
Sign in to UnlockConsider the following asymptotic Bode magnitude plot ( is in rad/s).

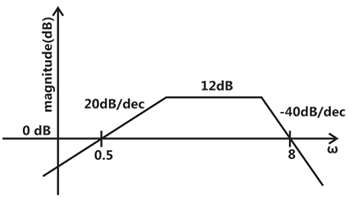
Which one of the following transfer functions is best represented by the above Bode magnitude plot?




Sign in to see the solution
Log in to view the explanation, track your attempts, and keep your progress.
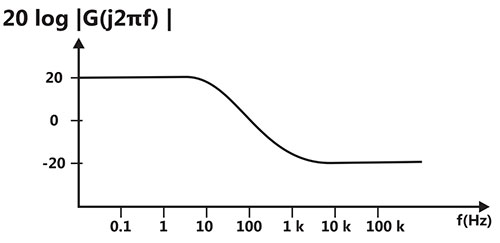
Sign in to UnlockA Bode magnitude plot for the transfer function G(s) of a plant is shown in the figure. Which one of the following transfer functions best describes the plant?




Sign in to see the solution
Log in to view the explanation, track your attempts, and keep your progress.
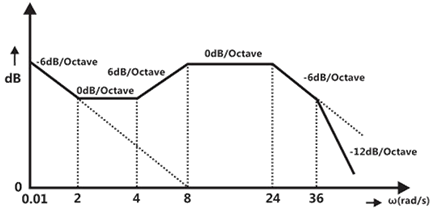
Sign in to UnlockThe Bode magnitude plot of the transfer function is shown below :

Note that -6dB/octave = -20dB/decade. The value of is _______________.

Sign in to see the solution
Log in to view the explanation, track your attempts, and keep your progress.
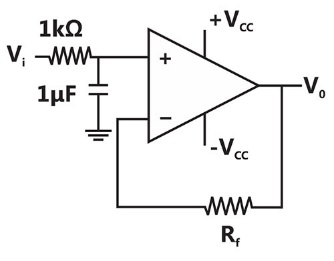
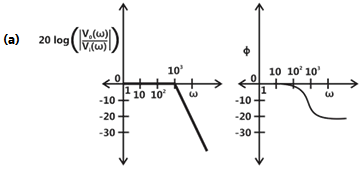
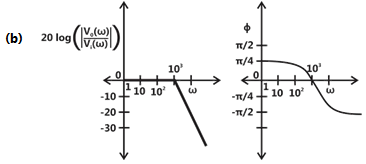
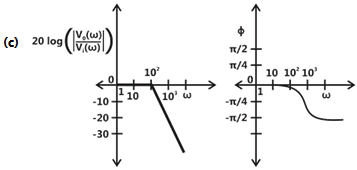
Sign in to UnlockIn the figure shown, assume the op – amp to be ideal. Which of the alternatives gives the correct Bode plots for the transfer function ?

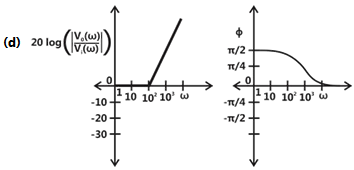
Sign in to see the solution
Log in to view the explanation, track your attempts, and keep your progress.
Sign in to UnlockFor the transfer function

The values of the constant gain term and the highest corner frequency of the Bode plot respectively are
Sign in to see the solution
Log in to view the explanation, track your attempts, and keep your progress.
Sign in to UnlockThe magnitude Bode plot of a network s shown in the figure
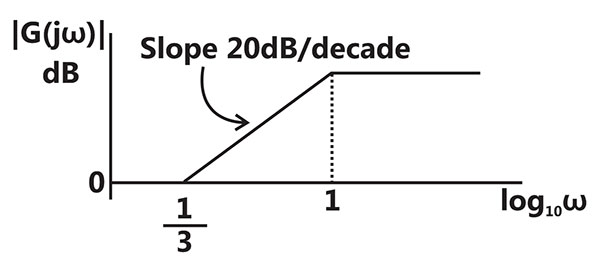
The maximum phase angle and the corresponding gain respectively, are


and 1.73dB

and 4.77dB
and 4.77dB

and 1.73dB
Sign in to see the solution
Log in to view the explanation, track your attempts, and keep your progress.
Sign in to UnlockThe Bode plot of a transfer function G(s) is shown in the figure below.
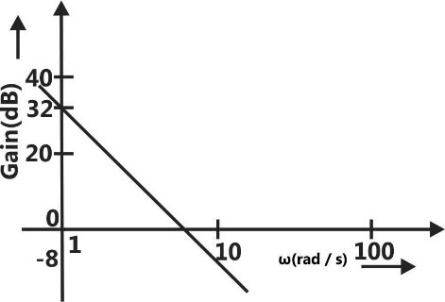
The gain (20log|G(s)|) is 32 dB and -8 dB at 1rad/s and 10rad/s respectively. The phase is negative for all ω. Then G(s) is




Sign in to see the solution
Log in to view the explanation, track your attempts, and keep your progress.
Sign in to UnlockThe asymptotic approximation of the log-magnitude v/s frequency plot of a system containing only real poles and zeros is shown. Its transfer function is
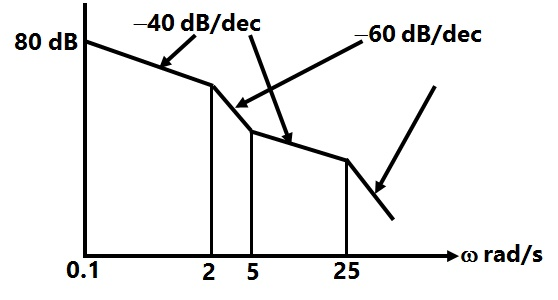




Sign in to see the solution
Log in to view the explanation, track your attempts, and keep your progress.
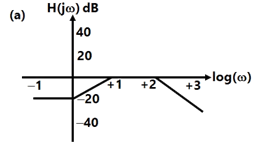
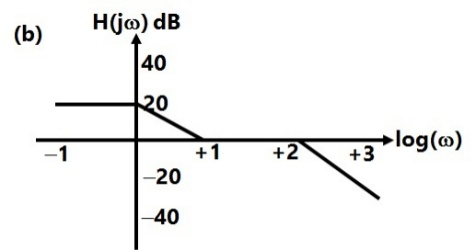
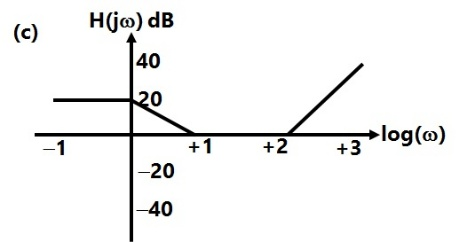
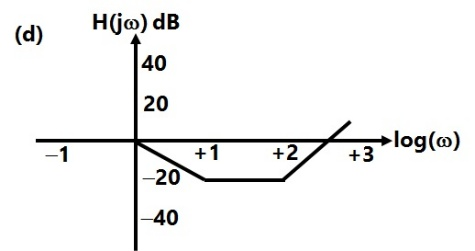
Sign in to UnlockThe Bode magnitude plot of is

Sign in to see the solution
Log in to view the explanation, track your attempts, and keep your progress.
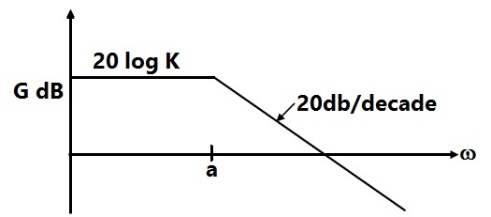
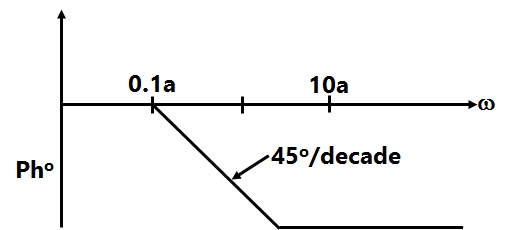
Sign in to UnlockThe asymptotic Bode plot of the transfer function is given in figure. The error in phase angle and dB gain at a frequency of ω=0.5 a are respectively.

Sign in to see the solution
Log in to view the explanation, track your attempts, and keep your progress.
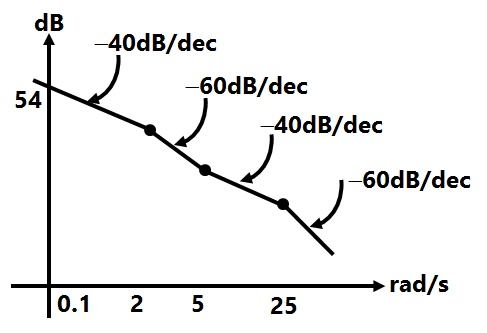
Sign in to UnlockThe asymptotic approximation of the log-magnitude versus frequency plot of a minimum phase system with real poles and one zero is shown in figure. Its transfer function is




Sign in to see the solution
Log in to view the explanation, track your attempts, and keep your progress.
Sign in to UnlockA unit feedback system has an open-loop transfer function of

(a) Determine the magnitude of G(jω) in dB at an angular frequency of ω= 20 rad/sec.
(b) Determine the phase margin in degrees.
(c) Determine the gain margin in dB.
(d) Is the system stable or unstable?
Sign in to see the solution
Log in to view the explanation, track your attempts, and keep your progress.
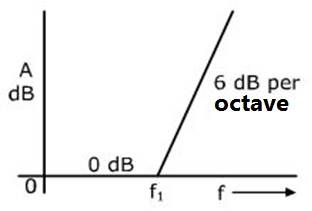
Sign in to UnlockThe function corresponding to the Bode plot of the figure is




Sign in to see the solution
Log in to view the explanation, track your attempts, and keep your progress.
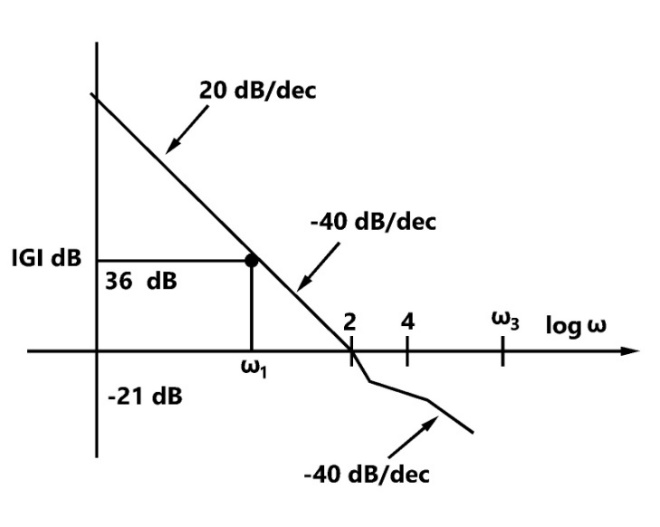
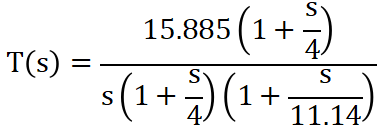
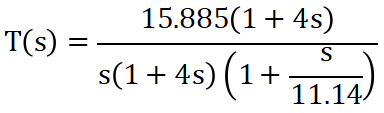
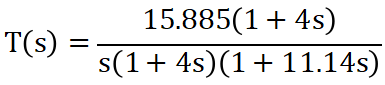
Sign in to UnlockThe asymptotic magnitude Body plot of a system is given fig. Find the transfer function of the system analytically. It is known that the system is minimal phase system
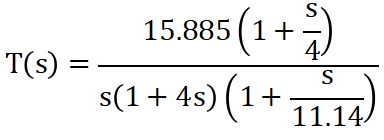
Sign in to see the solution
Log in to view the explanation, track your attempts, and keep your progress.
Sign in to UnlockThe system having the Bode magnitude plot shown in figure has the transfer function
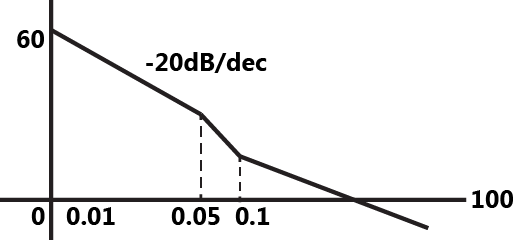




Sign in to see the solution
Log in to view the explanation, track your attempts, and keep your progress.
Sign in to Unlock