Control Systems
Frequency Domain Analysis
Practice questions from Frequency Domain Analysis.
63
Total0
Attempted0
Correct0
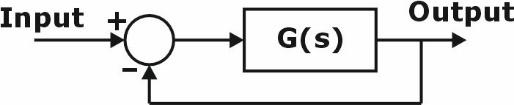
IncorrectThe Nyquist plot of a strictly stable having the numerator polynomial as encircles the critical point -1 once in the anti-clockwise direction. Which one of the following statements on the closed-loop system shown in figure, is correct?


Explanation Locked!
Unlock this branch to view the explanation, track, bookmark and more.
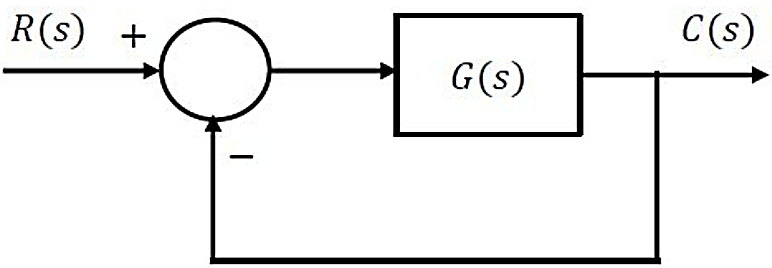
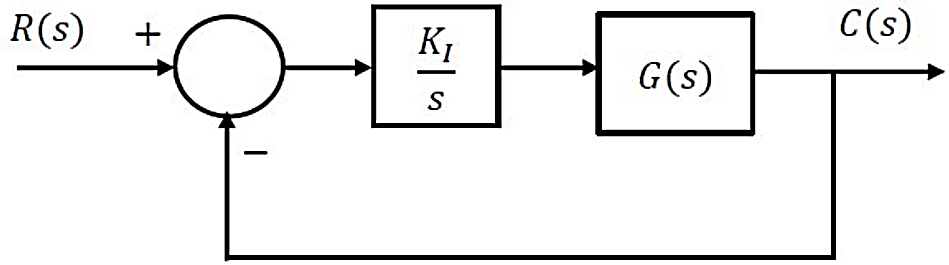
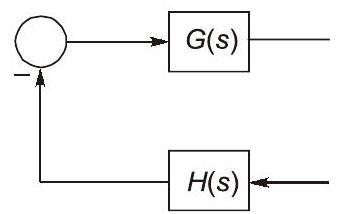
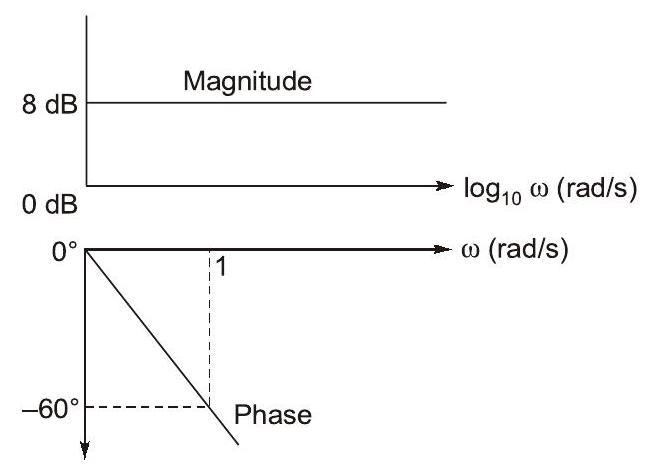
Sign in to UnlockConsider the stable closed-loop system shown in the figure. The asymptotic Bode magnitude plot of has a constant slope of decade at least till with the gain crossover frequency being . The asymptotic Bode phase plot remains constant at at least till . The steady-state error of the closed-loop system for a unit ramp input is ________ (rounded off to 2 decimal places).


Explanation Locked!
Unlock this branch to view the explanation, track, bookmark and more.
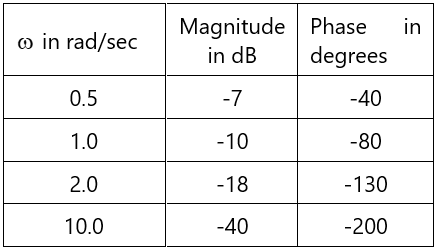
Sign in to UnlockConsider the stable closed-loop system shown in the figure. The magnitude and phase values of the frequency response of are given in the table. The value of the gain for a phase margin is ________ (rounded off to 2 decimal places).


Explanation Locked!
Unlock this branch to view the explanation, track, bookmark and more.
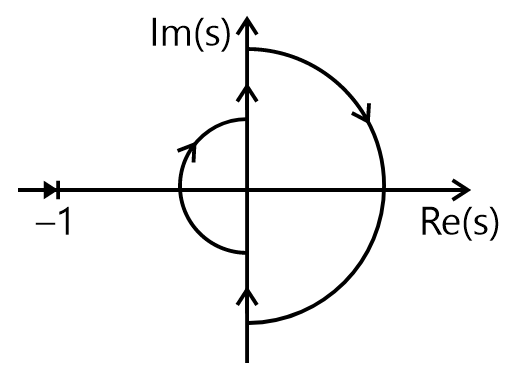
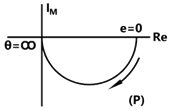
Sign in to UnlockIn the Nyquist plot of the open-loop transfer function

Corresponding to the feedback loop shown in the figure, the infinite semi-circular arc of the Nyquist contour in s-plane is mapped into a point at


Explanation Locked!
Unlock this branch to view the explanation, track, bookmark and more.
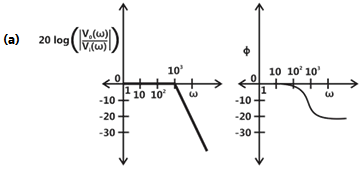
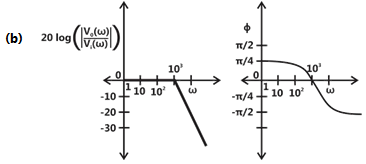
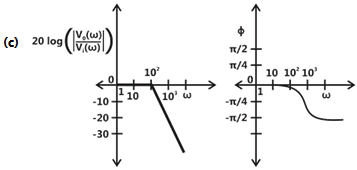
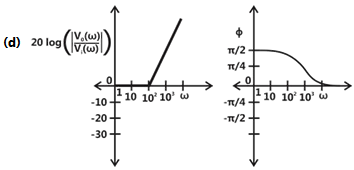
Sign in to UnlockThe magnitude and phase plots of an LTI system are shown in the figure. The transfer function of the system is


Explanation Locked!
Unlock this branch to view the explanation, track, bookmark and more.
Sign in to UnlockThe transfer function of a real system, H(s), is given as:
where A, B, C and D are positive constants. This system cannot operate as

Explanation Locked!
Unlock this branch to view the explanation, track, bookmark and more.
Sign in to UnlockThe Bode magnitude plot of a first order stable system is constant with frequency. The asymptotic value of the high frequency phase, for the system, is −180°. This system has

Explanation Locked!
Unlock this branch to view the explanation, track, bookmark and more.
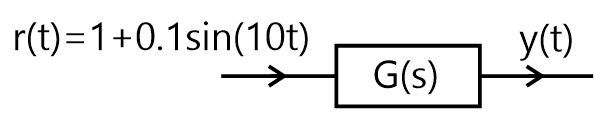
Sign in to UnlockAn LTI system is shown in the figure where G(s) . The steady state output of the system, to the input r(t), is given as The values of a and b will be


Explanation Locked!
Unlock this branch to view the explanation, track, bookmark and more.
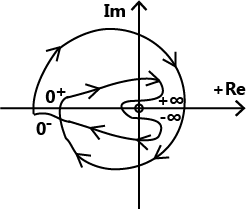
Sign in to UnlockThe open loop transfer function of a unity gain negative feedback system is given as

The Nyquist contour in the s-plane encloses the entire right half plane and a small neighbourhood around the origin in the left half plane, as shown in the figure below. The number of encirclemenets of the point (-1+j0) by the Nyquist plot of G(s), corresponding to the Nyquist contour, is denoted as N. Then N equals to
Explanation Locked!
Unlock this branch to view the explanation, track, bookmark and more.
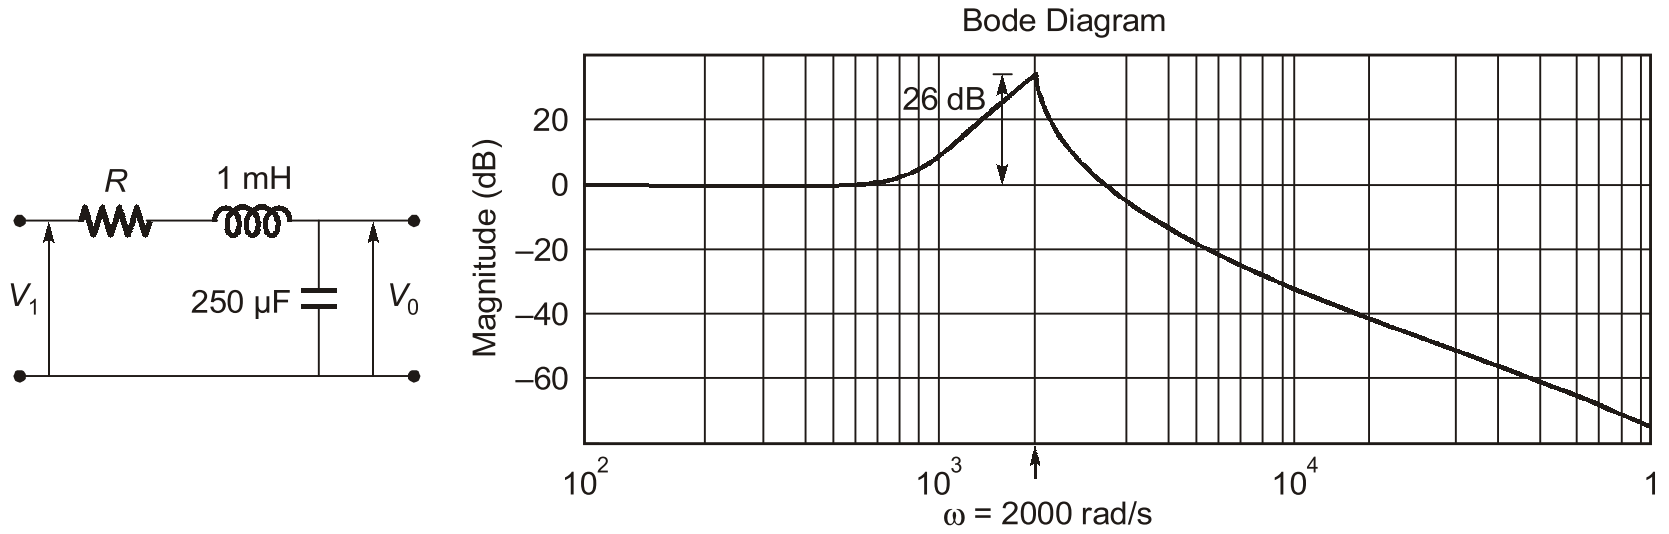
Sign in to UnlockThe Bode magnitude plot for the transfer function of the circuit is as shown. The value of R is _______ Ω. (Round off to 2 decimal places.)

Explanation Locked!
Unlock this branch to view the explanation, track, bookmark and more.
Sign in to UnlockA signal generator having a source resistance of . is set to generate a 1 kHz sinewave. Open circuit terminal voltage is 10 V peak-to-peak. Connecting a capacitor across the terminals reduces the voltage to 8 V peak-to-peak. The value of this capacitor is ________ . (Round off to 2 decimal places.)


Explanation Locked!
Unlock this branch to view the explanation, track, bookmark and more.
Sign in to UnlockConsider a negative unity feedback system with forward path transfer function where K, a, b, c are positive real numbers. For a Nyquist path enclosing the entire imaginary axis and right half of the s-plane in the clockwise direction, the Nyquist plot of (l + G(s)), encircles the origin of (l + G(s))-plane once in the clockwise direction and never passes through this origin for a certain value of K. Then, the number of poles of lying in the open right half of the s-plane is _______.


Explanation Locked!
Unlock this branch to view the explanation, track, bookmark and more.
Sign in to UnlockA stable real linear time-invariant system with single pole at p, has a transfer function with a dc gain of 5. The smallest positive frequency, in rad/s, at unity gain is closest to:

Explanation Locked!
Unlock this branch to view the explanation, track, bookmark and more.
Sign in to UnlockThe open loop transfer function of a unity feedback system is given by

In G(s) plane, the Nyquist plot of G(s) passes through the negative real axis at the point
Explanation Locked!
Unlock this branch to view the explanation, track, bookmark and more.
Sign in to UnlockThe asymptotic Bode magnitude plot of a minimum phase transfer function G(s) is shown below.
Consider the following two statements.
Statement I: Transfer function G(s) has three poles and one zero.
Statement II: At very high frequency , the phase angle


Which one of the following options is correct?
Explanation Locked!
Unlock this branch to view the explanation, track, bookmark and more.
Sign in to UnlockThe transfer function of a system is given by, . Let the output of the system be for the input, . Then the minimum and maximum values of (in radians) are respectively


Explanation Locked!
Unlock this branch to view the explanation, track, bookmark and more.
Sign in to UnlockConsider the unity feedback control system shown. The value of K that results in a phase margin of the system to be 30° is _________. (Give the answer up to two decimal places).
Explanation Locked!
Unlock this branch to view the explanation, track, bookmark and more.
Sign in to UnlockThe transfer function of a system is . The steady state output y(t) is A for the input . The value of A and , respectively are


Explanation Locked!
Unlock this branch to view the explanation, track, bookmark and more.
Sign in to UnlockThe phase cross-over frequency of the transfer function in rad/s is


3

Explanation Locked!
Unlock this branch to view the explanation, track, bookmark and more.
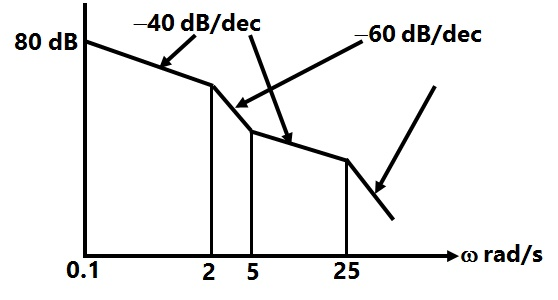
Sign in to UnlockConsider the following asymptotic Bode magnitude plot ( is in rad/s).

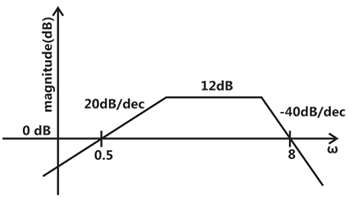
Which one of the following transfer functions is best represented by the above Bode magnitude plot?


Explanation Locked!
Unlock this branch to view the explanation, track, bookmark and more.
Sign in to UnlockLoop transfer function of a feedback system is . Take the Nyquist contour in the clockwise direction. Then, the Nyquist plot of G(s)H(s) encircles


Explanation Locked!
Unlock this branch to view the explanation, track, bookmark and more.
Sign in to UnlockConsider a linear time-invariant system with transfer function

If the input is cos(t) and the steady output is , then the value of A is___________.

Explanation Locked!
Unlock this branch to view the explanation, track, bookmark and more.
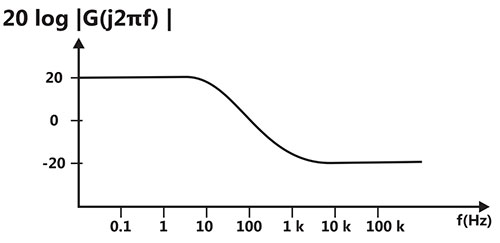
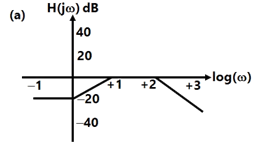
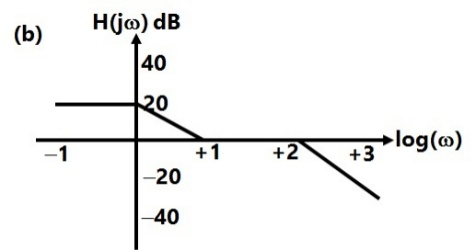
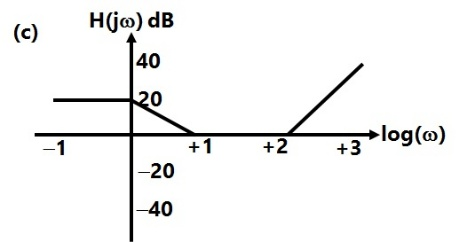
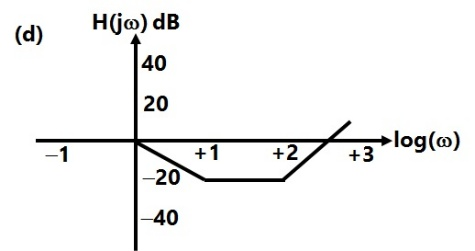
Sign in to UnlockA Bode magnitude plot for the transfer function G(s) of a plant is shown in the figure. Which one of the following transfer functions best describes the plant?


Explanation Locked!
Unlock this branch to view the explanation, track, bookmark and more.
Sign in to UnlockThe transfer function of a second order real system with a perfectly flat magnitude response of unity has a pole at
(2 – j3). List all the poles and zeroes.
Explanation Locked!
Unlock this branch to view the explanation, track, bookmark and more.
Sign in to UnlockNyquist plots of two functions and are shown in figure.


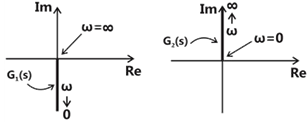
Nyquist plot of the product of is

Explanation Locked!
Unlock this branch to view the explanation, track, bookmark and more.
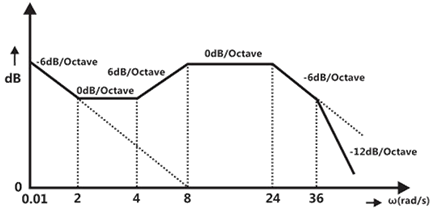
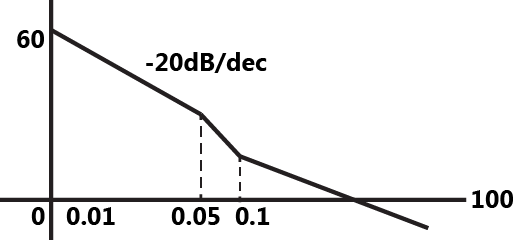
Sign in to UnlockThe Bode magnitude plot of the transfer function is shown below :

Note that -6dB/octave = -20dB/decade. The value of is _______________.

Explanation Locked!
Unlock this branch to view the explanation, track, bookmark and more.
Sign in to UnlockIn the figure shown, assume the op – amp to be ideal. Which of the alternatives gives the correct Bode plots for the transfer function ?

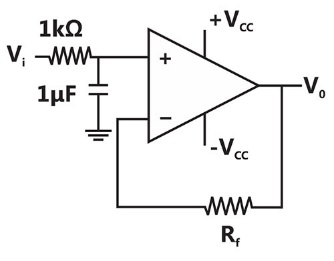
Explanation Locked!
Unlock this branch to view the explanation, track, bookmark and more.
Sign in to UnlockFor the transfer function

The values of the constant gain term and the highest corner frequency of the Bode plot respectively are
Explanation Locked!
Unlock this branch to view the explanation, track, bookmark and more.
Sign in to UnlockA single-input single-output feedback system has forward transfer function G(s) and feedback transfer function(s). It is given that. Which of the following is true about the stability of the system?

Explanation Locked!
Unlock this branch to view the explanation, track, bookmark and more.
Sign in to UnlockThe magnitude Bode plot of a network s shown in the figure
The maximum phase angle and the corresponding gain respectively, are


and 1.73dB

and 4.77dB
and 4.77dB

and 1.73dB
Explanation Locked!
Unlock this branch to view the explanation, track, bookmark and more.
Sign in to UnlockThe Bode plot of a transfer function G(s) is shown in the figure below.
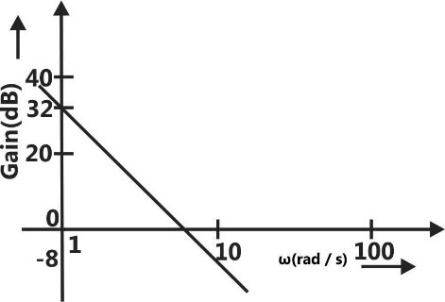
The gain (20log|G(s)|) is 32 dB and -8 dB at 1rad/s and 10rad/s respectively. The phase is negative for all ω. Then G(s) is


Explanation Locked!
Unlock this branch to view the explanation, track, bookmark and more.
Sign in to UnlockA system with transfer function
is excited by . The steady state output of the system is zero at


Explanation Locked!
Unlock this branch to view the explanation, track, bookmark and more.
Sign in to UnlockThe frequency response of a linear system is provided in the tabular form below

1.3 | 1.2 | 1.0 | 0.8 | 0.5 | 0.3 | ||
-130° | -140° | -150° | -160° | -180° | -200° |


The gain margin and phase margin of the system are
6dB and

6dB and
–6dB and
-6dB and
Explanation Locked!
Unlock this branch to view the explanation, track, bookmark and more.
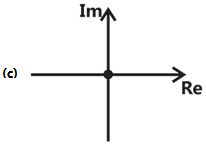
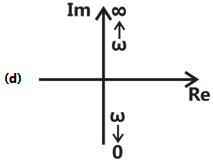
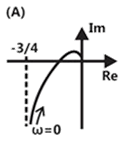
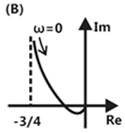
Sign in to UnlockThe frequency response of plotted in the complex plane is


Explanation Locked!
Unlock this branch to view the explanation, track, bookmark and more.
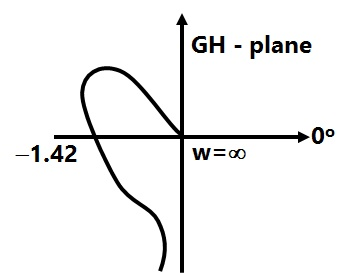
Sign in to UnlockThe polar plot of an open loop stable system is shown below. The closed loop system is
Explanation Locked!
Unlock this branch to view the explanation, track, bookmark and more.
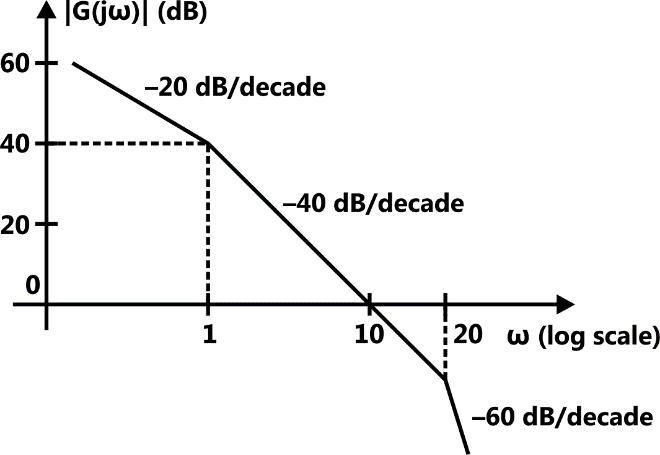
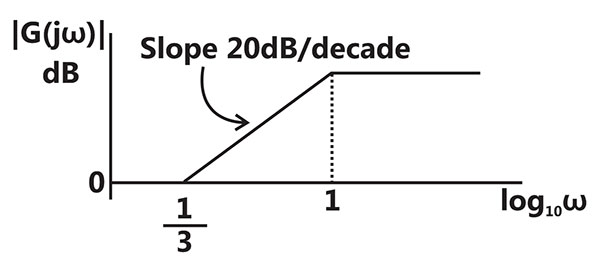
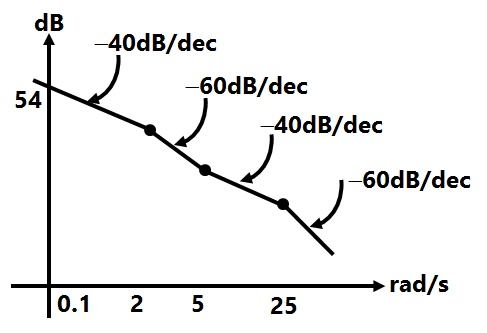
Sign in to UnlockThe asymptotic approximation of the log-magnitude v/s frequency plot of a system containing only real poles and zeros is shown. Its transfer function is


Explanation Locked!
Unlock this branch to view the explanation, track, bookmark and more.
Sign in to UnlockThe open loop transfer function of a unity feedback system is given by . The gain margin of this system is

Explanation Locked!
Unlock this branch to view the explanation, track, bookmark and more.
Sign in to UnlockIf and then for , the Nyquist plot for becomes asymptotic to the line


x = 0


Explanation Locked!
Unlock this branch to view the explanation, track, bookmark and more.
Sign in to UnlockThe Bode magnitude plot of is

Explanation Locked!
Unlock this branch to view the explanation, track, bookmark and more.
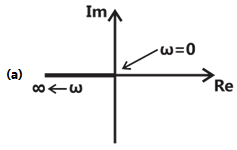
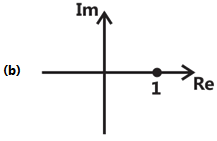
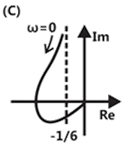
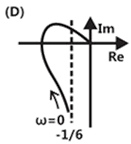
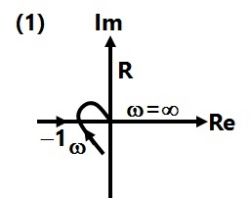
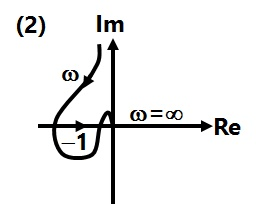
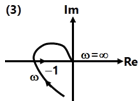
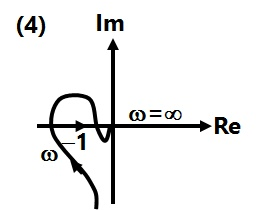
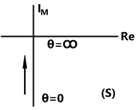
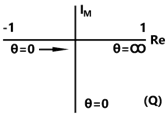
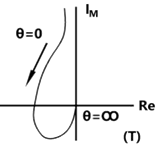
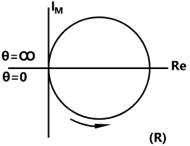
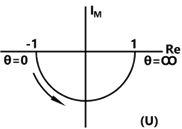
Sign in to UnlockConsider the following Nyquist plots of loop transfer functions over ω = 0 to ω= ∞. Which of these plots represents a stable closed loop system?
Explanation Locked!
Unlock this branch to view the explanation, track, bookmark and more.
Sign in to UnlockA system with zero initial conditions has the closed loop transfer function. The system output is zero at the frequency

Explanation Locked!
Unlock this branch to view the explanation, track, bookmark and more.
Sign in to UnlockThe gain margin of a unity feedback control system with the open loop transfer function is:

0


Explanation Locked!
Unlock this branch to view the explanation, track, bookmark and more.
Sign in to UnlockIn the GH(s) plane, the Nyquist plot of the loop transfer function passes through the negative real axis at the point

Explanation Locked!
Unlock this branch to view the explanation, track, bookmark and more.
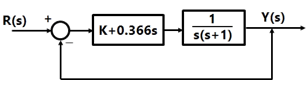
Sign in to UnlockIf the compensated system shown in Figure has a phase margin of 60° at the crossover frequency of 1rad/sec, the value of the gain K is:
Explanation Locked!
Unlock this branch to view the explanation, track, bookmark and more.
Sign in to UnlockThe Nyquist plot of loop transfer function G(s) H(s) of a closed loop control system passes through the point (−1, j0) in the G(s) H(s) plane. The phase margin of the system is
Explanation Locked!
Unlock this branch to view the explanation, track, bookmark and more.
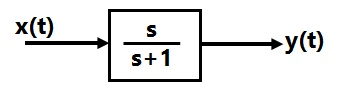
Sign in to UnlockIn the system shown in figure, the input x(t)=sin t. In the steady-state, the response y(t) will be


Explanation Locked!
Unlock this branch to view the explanation, track, bookmark and more.
Sign in to UnlockThe open loop transfer function of a unity feedback control system is given as

The value of ‘a’ to give a phase margin of 45° is equal to
Explanation Locked!
Unlock this branch to view the explanation, track, bookmark and more.
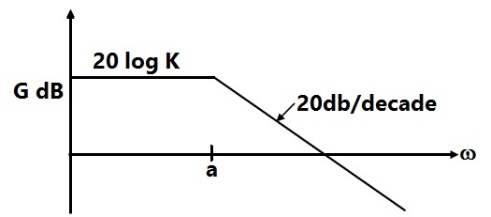
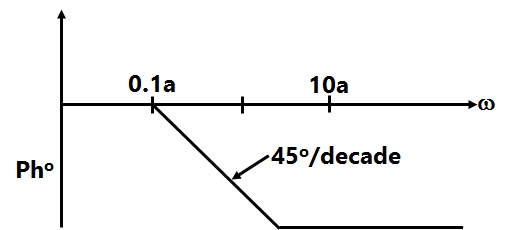
Sign in to UnlockThe asymptotic Bode plot of the transfer function is given in figure. The error in phase angle and dB gain at a frequency of ω=0.5 a are respectively.

Explanation Locked!
Unlock this branch to view the explanation, track, bookmark and more.
Sign in to UnlockThe polar plot of a type-1, 3-pole, open-loop system is shown in Figure, the closed loop system is
Explanation Locked!
Unlock this branch to view the explanation, track, bookmark and more.
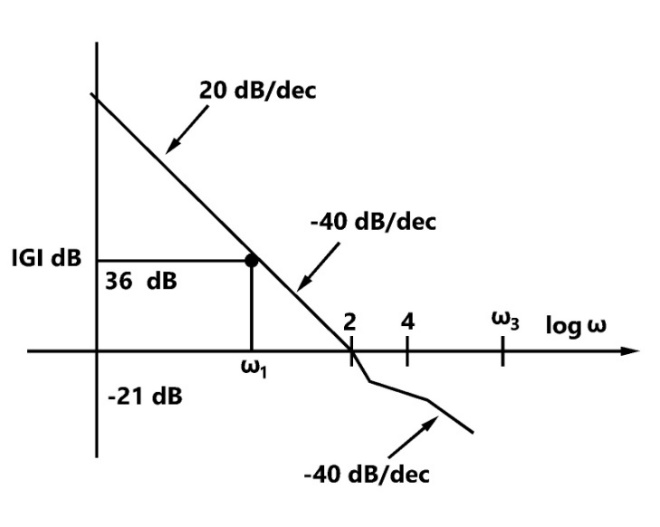
Sign in to UnlockThe asymptotic approximation of the log-magnitude versus frequency plot of a minimum phase system with real poles and one zero is shown in figure. Its transfer function is


Explanation Locked!
Unlock this branch to view the explanation, track, bookmark and more.
Sign in to UnlockA unit feedback system has an open-loop transfer function of

(a) Determine the magnitude of G(jω) in dB at an angular frequency of ω= 20 rad/sec.
(b) Determine the phase margin in degrees.
(c) Determine the gain margin in dB.
(d) Is the system stable or unstable?
Explanation Locked!
Unlock this branch to view the explanation, track, bookmark and more.
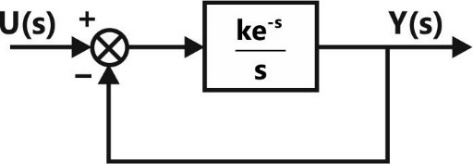
Sign in to UnlockOpen-loop transfer function of a unity-feedback system is:

Given : when


(a) Determine the phase margin when

(b) Comment in one sentence on the effect of dead time on the stability of the system
(c) Determine the maximum value of dead time for the closed-loop system to be stable

(a) Phase margin

(b) Phase margin reduces and stability decreases
(b) Phase margin reduces and stability increases
(c)

Explanation Locked!
Unlock this branch to view the explanation, track, bookmark and more.
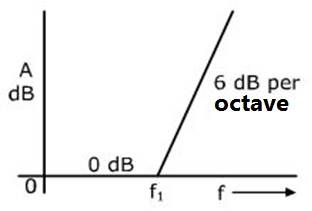
Sign in to UnlockThe function corresponding to the Bode plot of the figure is


Explanation Locked!
Unlock this branch to view the explanation, track, bookmark and more.
Sign in to UnlockThe asymptotic magnitude Body plot of a system is given fig. Find the transfer function of the system analytically. It is known that the system is minimal phase system
Explanation Locked!
Unlock this branch to view the explanation, track, bookmark and more.
Sign in to UnlockA unity feedback system with the open loop transfer function has gain margin of…. dB

Explanation Locked!
Unlock this branch to view the explanation, track, bookmark and more.
Sign in to UnlockDetermine the transfer function of the system having the following state variable representation:


Explanation Locked!
Unlock this branch to view the explanation, track, bookmark and more.
Sign in to UnlockThe closed-loop transfer function of a control system is given by . For the input , the steady state value of c(t) is equal to


1


Explanation Locked!
Unlock this branch to view the explanation, track, bookmark and more.
Sign in to UnlockThe block diagram of the control system is given in the figure.
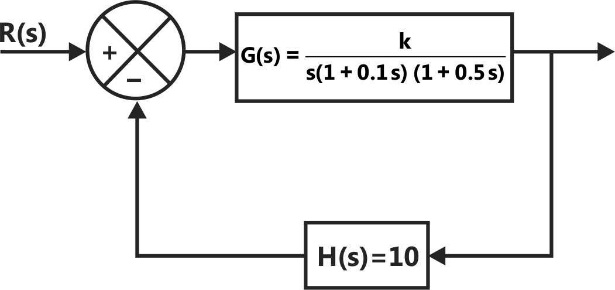
Nyquist locus

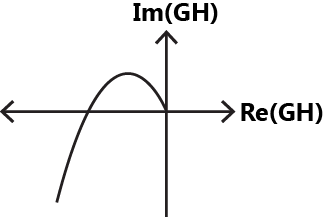
Phase cross-over frequency = 4.472 rad/sec
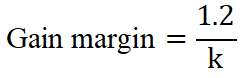
For K=1.2, phase margin = 0
Explanation Locked!
Unlock this branch to view the explanation, track, bookmark and more.
Sign in to UnlockMatch the polar plots for the following functions on the left hand side *(MTA since incomplete question)


MTA since incomplete question
Explanation Locked!
Unlock this branch to view the explanation, track, bookmark and more.
Sign in to UnlockA unity feedback system has the open loop transfer function

The Nyquist plot of G encircles the origin
Explanation Locked!
Unlock this branch to view the explanation, track, bookmark and more.
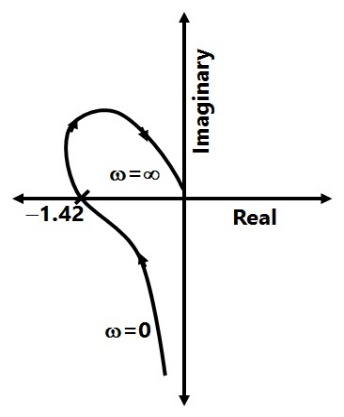
Sign in to UnlockWhich of the following is the transfer function of a system having the Nyquist plot in figure?


Explanation Locked!
Unlock this branch to view the explanation, track, bookmark and more.
Sign in to UnlockThe system having the Bode magnitude plot shown in figure has the transfer function


Explanation Locked!
Unlock this branch to view the explanation, track, bookmark and more.
Sign in to UnlockAn underdamped second-order system having a transfer function of the form has a frequency response plot shown in the figure. Then the system gain K is _______________ and the damping factor is approximately ___________________.

System gain K = 2
Damping factor

System gain K = 1
Damping factor

Explanation Locked!
Unlock this branch to view the explanation, track, bookmark and more.
Sign in to Unlock