Control Systems
Frequency Domain Analysis
Practice questions from Frequency Domain Analysis.
71
Total0
Attempted0
Correct0
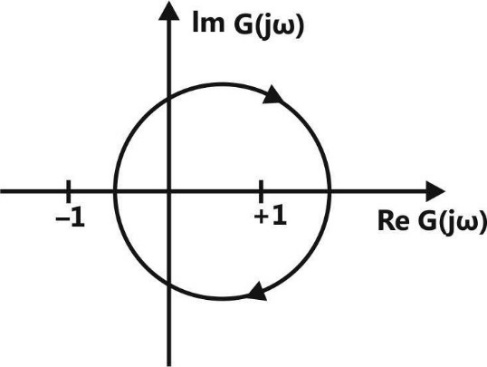
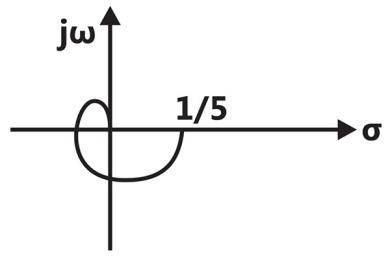
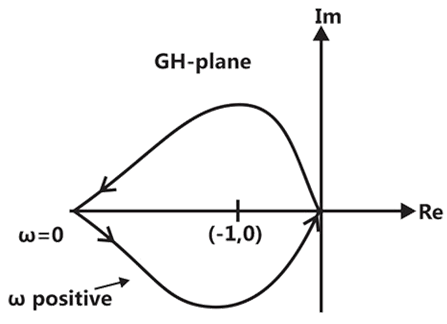
IncorrectThe Nyquist plot of a system is given in the figure below. Let , and be the positive frequencies at the points , and , respectively.


Which one of the following statements is TRUE?
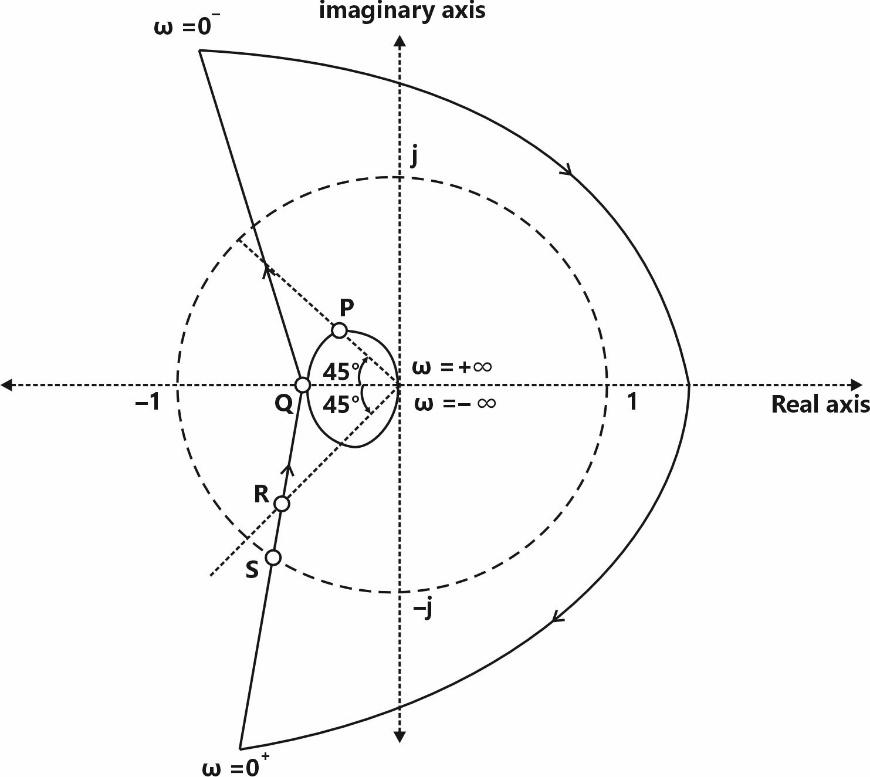
is the gain crossover frequency and is the phase crossover frequency

is the gain crossover frequency and is the phase crossover frequency


is the gain crossover frequency and is the phase crossover frequency
is the gain crossover frequency and is the phase crossover frequency
Sign in to see the solution
Log in to view the explanation, track your attempts, and keep your progress.
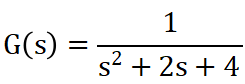
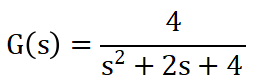
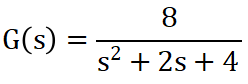
Sign in to UnlockIn the context of Bode magnitude plots. . decade is the same as

Sign in to see the solution
Log in to view the explanation, track your attempts, and keep your progress.
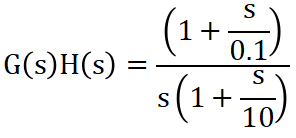
Sign in to UnlockThe open loop transfer function of a unity negative feedback system is , where and are positive constants. The phase cross-over frequency, in rad/s, is


Sign in to see the solution
Log in to view the explanation, track your attempts, and keep your progress.
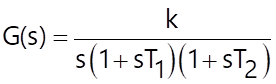
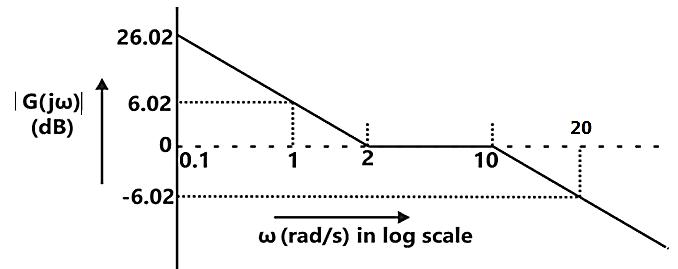
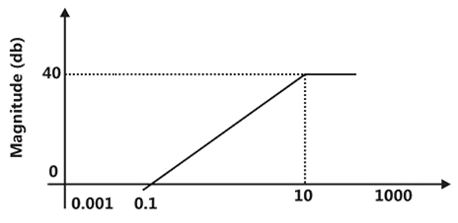
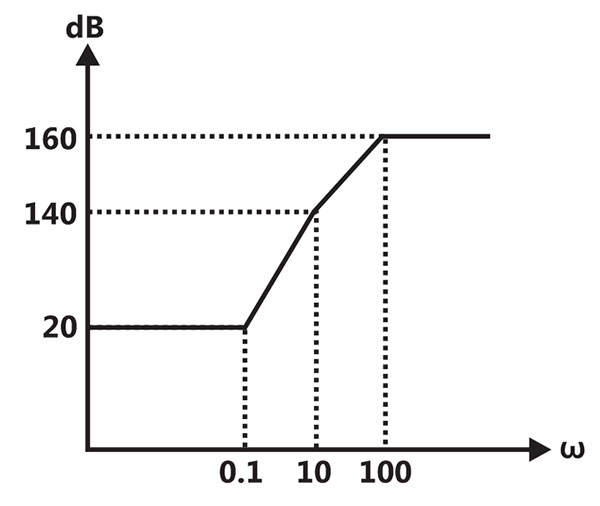
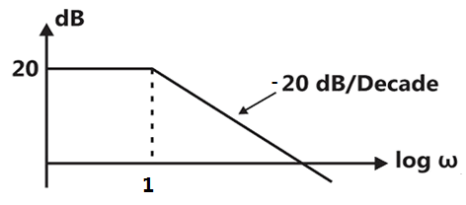
Sign in to UnlockThe asymptotic magnitude Bode plot of a minimum phase system is shown in the figure. The transfer function of the system is , where and c are positive constants. The value of is __________. (rounded off to the nearest integer).


Sign in to see the solution
Log in to view the explanation, track your attempts, and keep your progress.
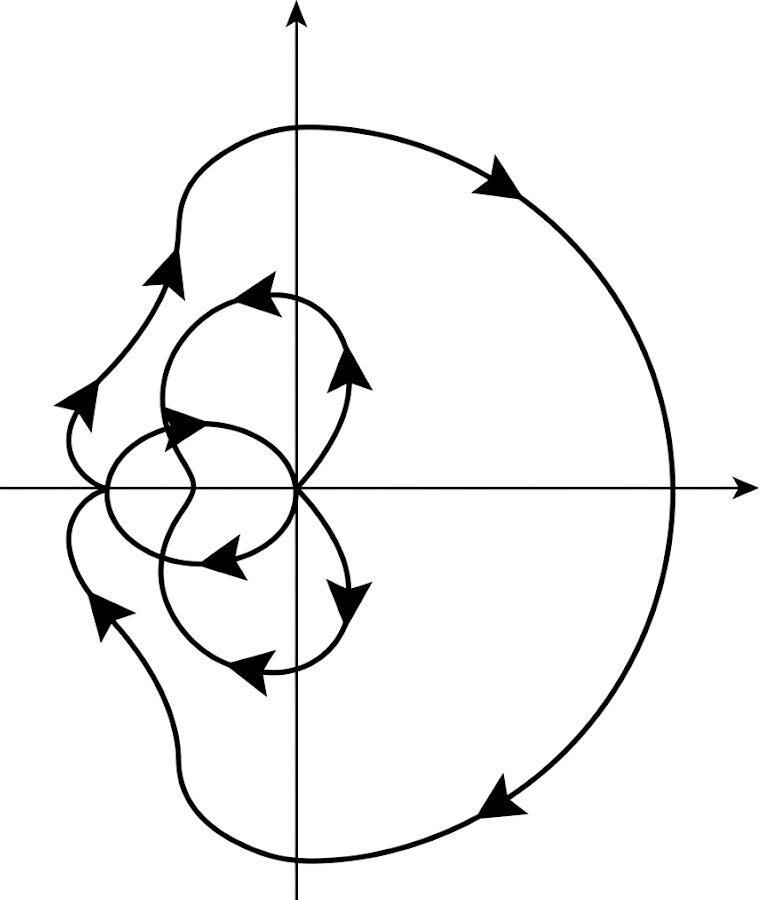
Sign in to UnlockConsider a closed-loop control system with unity negative feedback and in the forward path, where the gain . The complete Nyquist plot of the transfer function is shown in the figure. Note that the Nyquist contour has been chosen to have the clockwise sense. Assume has no poles on the closed right-half of the complex plane. The number of poles of the closed-loop transfer function in the closed right-half of the complex plane is ________.


Sign in to see the solution
Log in to view the explanation, track your attempts, and keep your progress.
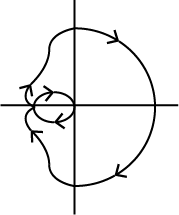
Sign in to UnlockThe complete Nyquist plot of the open-loop transfer function of a feedback control system is shown in the figure.


If has one zero in the right-half of the splane, the number of poles that the closed-loop system will have in the right-half of the s-plane is
Sign in to see the solution
Log in to view the explanation, track your attempts, and keep your progress.
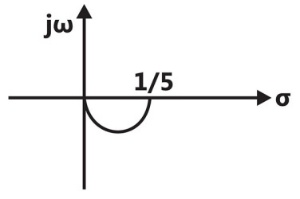
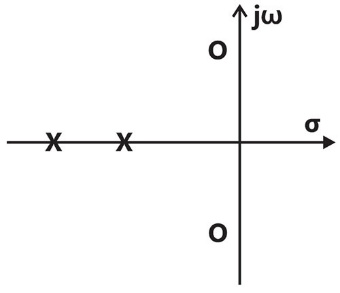
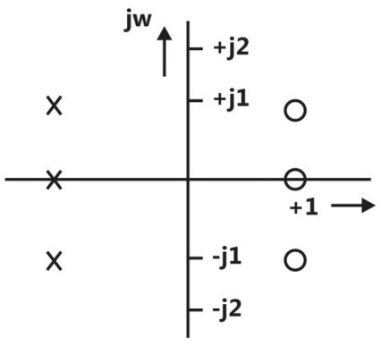
Sign in to UnlockThe pole-zero map of a rational function is shown below. When the closed contour is mapped into the -plane, then the mapping encircles.

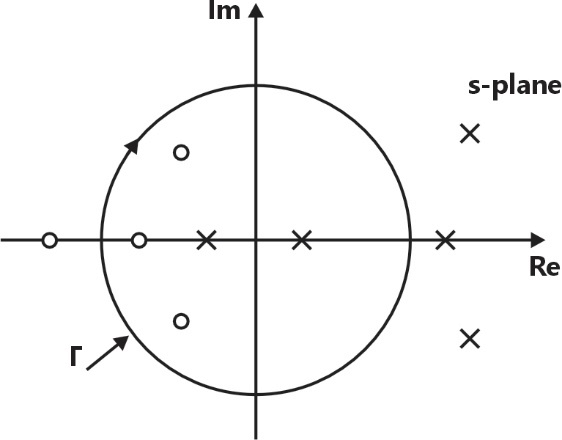
the point of the -plane once in the counter-clockwise direction.

the origin of the -plane once in the clockwise direction.
the origin of the -plane once in the counterclockwise direction.
the point of the -plane once in the clockwise direction.
Sign in to see the solution
Log in to view the explanation, track your attempts, and keep your progress.
Sign in to UnlockA system with transfer function

is subjected an input . The steady state output of the system is .


The value of “a” is __________.
Sign in to see the solution
Log in to view the explanation, track your attempts, and keep your progress.
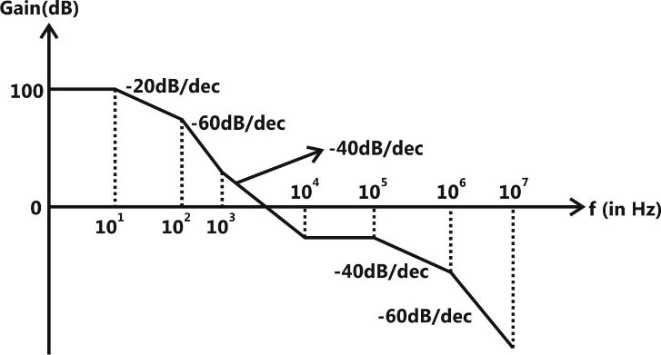
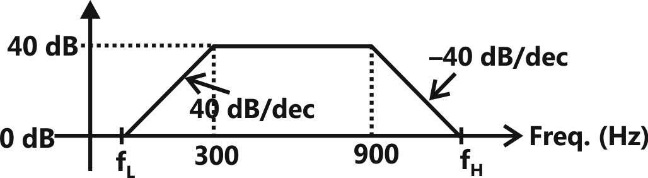
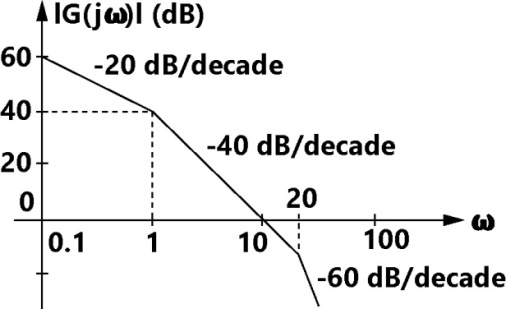
Sign in to UnlockFor the LTI system, the Bode plot for its gain is illustrated in the figure shown. The number of system poles and the number of system zerosin the frequency range is


Sign in to see the solution
Log in to view the explanation, track your attempts, and keep your progress.
Sign in to UnlockThe Nyquist stability criterion and the Routh criterion both are powerful analyst’s tools for determining the stability of feedback controllers. Identify which of the following statements is FALSE:
Sign in to see the solution
Log in to view the explanation, track your attempts, and keep your progress.
Sign in to UnlockThe figure below shows the Bode magnitude and phase plots of a stable transfer function
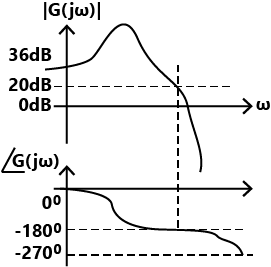

Consider the negative unity feedback configuration with gain k in the feed forward path. The closed loop is stable for. The maximum value of is ______.


Sign in to see the solution
Log in to view the explanation, track your attempts, and keep your progress.
Sign in to UnlockConsider a stable system with transfer function

where are real valued constants. The slope of the Bode log magnitude curve of G (s) converges to – 60 dB/decade as . A possible pair of values for p and q is


Sign in to see the solution
Log in to view the explanation, track your attempts, and keep your progress.
Sign in to UnlockThe Nyquist plot of the transfer function

does not encircle the point for K = 10 but does encircle the point for K = 100. Then the closed loop system (having unity gain feedback) is


Sign in to see the solution
Log in to view the explanation, track your attempts, and keep your progress.
Sign in to UnlockA unity feedback control system is characterized by the open-loop transfer function
.

The Nyquist path and the corresponding Nyquist plot of G(s) are shown in the figures below.
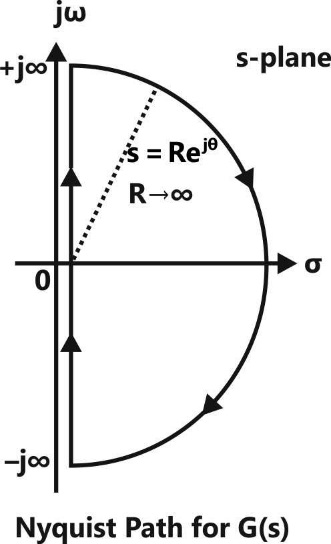
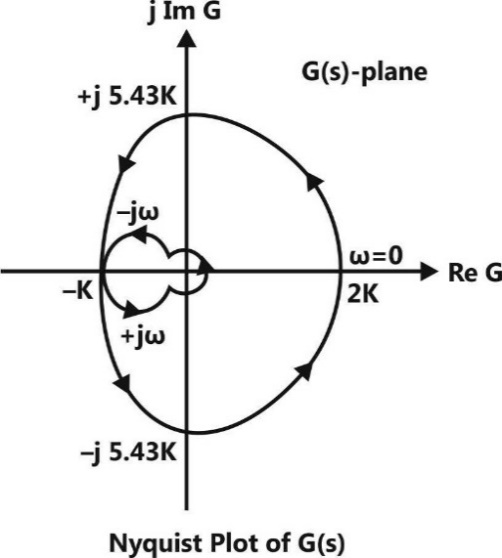
If , then the number of poles of the closed-loop transfer function that lie in the right-half of the s-plane is

Sign in to see the solution
Log in to view the explanation, track your attempts, and keep your progress.
Sign in to UnlockA closed-loop control system is stable if the Nyquist plot of the corresponding open loop transfer function
Encircles the s-plane point in the counter clockwise direction as many times as the number of right-half s-plane poles.

encircles the s-plane point in the clockwise direction as many times as the number of right-half s-plane poles.

Encircles the s-plane point in the counter clockwise direction as many times as the number of left-half s-plane poles.
Encircles the s-plane point in the counter clockwise direction as many times as the number of right-half s-plane zeros.

Sign in to see the solution
Log in to view the explanation, track your attempts, and keep your progress.
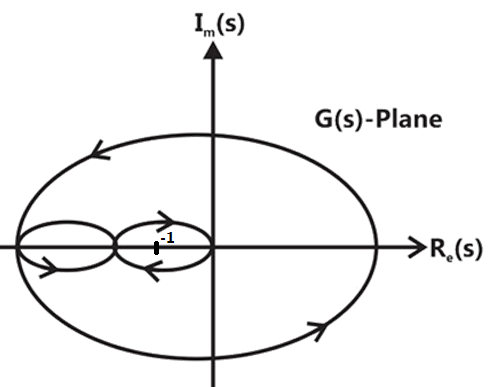
Sign in to UnlockThe number and direction of encirclements around the point in the complex plane by the Nyquist plot of is


Sign in to see the solution
Log in to view the explanation, track your attempts, and keep your progress.
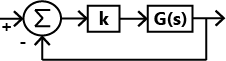
Sign in to UnlockIn the feedback system shown below .

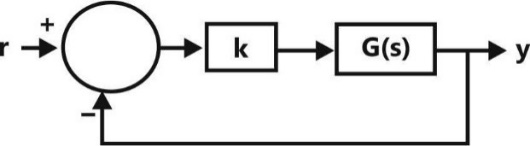
The positive value of k for which the gain margin of the loop is exactly 0 dB and the phase margin of the loop is exactly zero degree is ________.
Sign in to see the solution
Log in to view the explanation, track your attempts, and keep your progress.
Sign in to UnlockThe asymptotic Bode phase plot of , with k and both positive, is shown below.


The value of is ________.
Sign in to see the solution
Log in to view the explanation, track your attempts, and keep your progress.
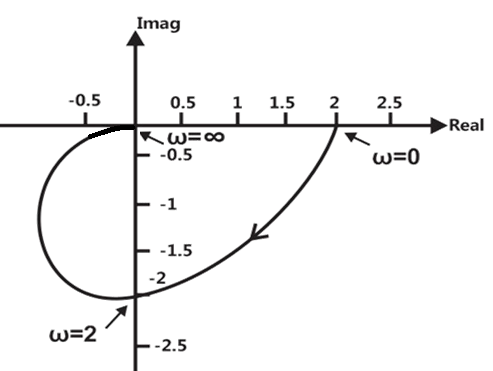
Sign in to UnlockThe polar plot of the transfer function for 0 ≤ ω < ∞ will be in the

Sign in to see the solution
Log in to view the explanation, track your attempts, and keep your progress.
Sign in to UnlockConsider the Bode plot shown in the figure. Assume that all the poles and zeros are real-valued.
The value of(in Hz) is ___________.

Sign in to see the solution
Log in to view the explanation, track your attempts, and keep your progress.
Sign in to UnlockThe phase margin (in degrees) of the system is _______.

Sign in to see the solution
Log in to view the explanation, track your attempts, and keep your progress.
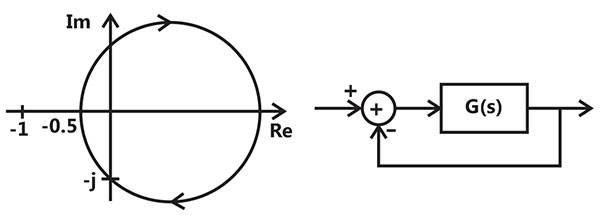
Sign in to UnlockConsider the feedback system shown in the figure. The Nyquist plot G(s) is also shown. Which one of the following conclusions is correct?
Sign in to see the solution
Log in to view the explanation, track your attempts, and keep your progress.
Sign in to UnlockThe phase margin in degrees of . Calculated using the asymptotic Bode plot is ________.

Sign in to see the solution
Log in to view the explanation, track your attempts, and keep your progress.
Sign in to UnlockThe Bode asymptotic magnitude plot of a minimum phase system is shown in the figure.
If the system is connected in a unity negative feedback configuration, the steady state error of the closed loop system, to a unit ramp input, is_________.
Sign in to see the solution
Log in to view the explanation, track your attempts, and keep your progress.
Sign in to UnlockIn a Bode magnitude plot, which one of the following slopes would be exhibited at high frequencies by a 4th order all-pole system?
Sign in to see the solution
Log in to view the explanation, track your attempts, and keep your progress.
Sign in to UnlockThe bode plot of a transfer function G(s) is shown in the figure below.
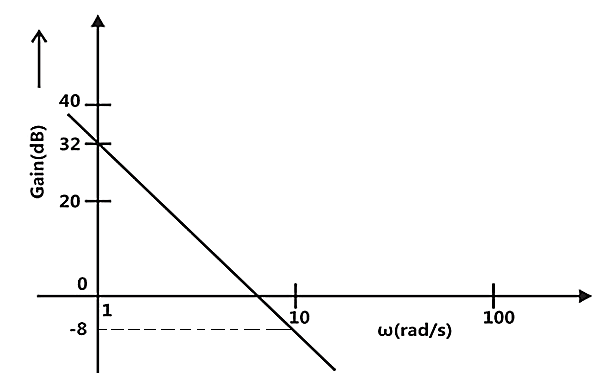
The gain is 32 dB and -8 dB at 1rad/s and 10rad/s respectively. The phase is negative for all. Then G(s) is


Sign in to see the solution
Log in to view the explanation, track your attempts, and keep your progress.
Sign in to UnlockFor the transfer function, the corresponding Nyquist plot for positive frequency has the form

Sign in to see the solution
Log in to view the explanation, track your attempts, and keep your progress.
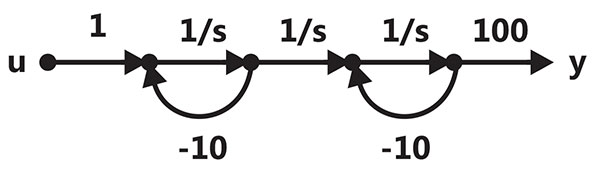
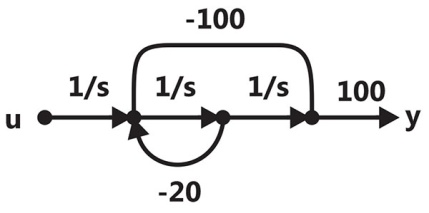
Sign in to UnlockThe input-output transfer function of a plant .

The plant is placed in a unity negative feedback configuration as shown in the figure below.
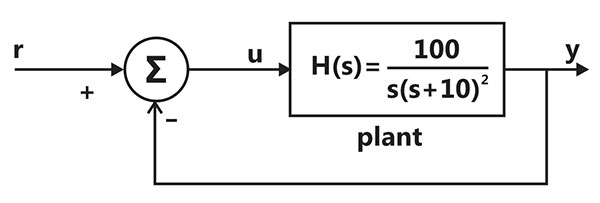
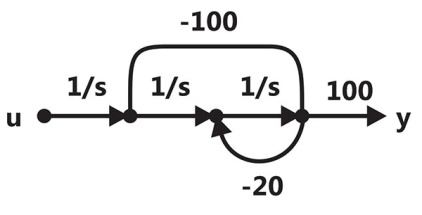
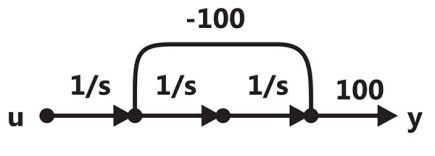
The signal flow graph that DOES NOT model the plant transfer function H(s) is
Sign in to see the solution
Log in to view the explanation, track your attempts, and keep your progress.
Sign in to UnlockThe input-output transfer function of a plant .
The plant is placed in a unity negative feedback configuration, as shown in the figure below.
The gain margin of the system under closed loop unity negative feedback is
Sign in to see the solution
Log in to view the explanation, track your attempts, and keep your progress.
Sign in to UnlockFor the asymptotic Bode magnitude plot shown below, the system transfer function can be


Sign in to see the solution
Log in to view the explanation, track your attempts, and keep your progress.
Sign in to UnlockThe Nyquist plot of a stable transfer function G(s) is shown in the figure. We are interested in the stability of the closed loop system in the feedback configuration shown.
Which of the following statements is true?
Sign in to see the solution
Log in to view the explanation, track your attempts, and keep your progress.
Sign in to UnlockThe Nyquist plot of a stable transfer function G(s) is shown in the figure. We are interested in the stability of the closed-loop system in the feedback configuration shown.
The gain and phase margins of G(s) for closed loop stability are
6 dB and

3 dB and
6 dB and

3 dB and
Sign in to see the solution
Log in to view the explanation, track your attempts, and keep your progress.
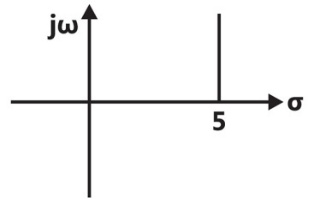
Sign in to UnlockThe pole-zero plot given below corresponds to a
Sign in to see the solution
Log in to view the explanation, track your attempts, and keep your progress.
Sign in to UnlockThe magnitude of frequency response of an under-damped second order system is 5 at 0 rad/sec and peaks to at rad/sec. The transfer function of the system is


Sign in to see the solution
Log in to view the explanation, track your attempts, and keep your progress.
Sign in to UnlockIf the closed-loop transfer function of a control system is given as then it is

Sign in to see the solution
Log in to view the explanation, track your attempts, and keep your progress.
Sign in to UnlockThe transfer function of a plant is .

The second-order approximation of T(s) using dominant pole concept is


Sign in to see the solution
Log in to view the explanation, track your attempts, and keep your progress.
Sign in to UnlockThe asymptotic Bode plot of a transfer function is as shown in the figure. The transfer function G(s) corresponding to this Bode plot is


Sign in to see the solution
Log in to view the explanation, track your attempts, and keep your progress.
Sign in to UnlockThe open-loop transfer function of a unity-gain feedback control system is given by .

The gain margin of the system in dB is given by
0
1
20

Sign in to see the solution
Log in to view the explanation, track your attempts, and keep your progress.
Sign in to UnlockConsider two transfer functions and.


The 3-dB bandwidths of their frequency responses are, respectively,
,


,
,
,
Sign in to see the solution
Log in to view the explanation, track your attempts, and keep your progress.
Sign in to UnlockThe Nyquist plot of for a closed loop control system, passes through (-1, j0) point in the GH plane. The gain margin of the system in dB is equal to

Sign in to see the solution
Log in to view the explanation, track your attempts, and keep your progress.
Sign in to UnlockConsider a unity-gain feedback control system whose open-loop transfer function is:

The value of “a” so that the system has a phase margin equal to is approximately equal to

Sign in to see the solution
Log in to view the explanation, track your attempts, and keep your progress.
Sign in to UnlockConsider a unity-gain feedback control system whose open-loop transfer function is:
with the value of “a” set for a phase-margin of, the value of unit-impulse response of the open-loop system at t = 1 second is equal to
Sign in to see the solution
Log in to view the explanation, track your attempts, and keep your progress.
Sign in to UnlockThe open loop transfer function of a unity feedback is given by .

The gain and phase crossover frequencies in rad/sec are, respectively
Sign in to see the solution
Log in to view the explanation, track your attempts, and keep your progress.
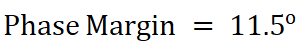
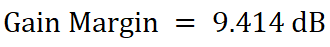
Sign in to UnlockThe open loop transfer function of a unity feedback is given by .
Based on the above results, the gain and phase margins of the system will be
-7.09 dB and

7.09 dB and
7.09 dB and

-7.09 dB and
Sign in to see the solution
Log in to view the explanation, track your attempts, and keep your progress.
Sign in to UnlockThe polar diagram of a conditionally stable system for open loop gain K = 1 is shown in the figure. The open loop transfer function of the system is known to be stable. The closed loop system is stable for


Sign in to see the solution
Log in to view the explanation, track your attempts, and keep your progress.
Sign in to UnlockThe gain margin for the system with open-loop transfer function, is

0
1

Sign in to see the solution
Log in to view the explanation, track your attempts, and keep your progress.
Sign in to UnlockConsider the Bode magnitude plot shown in Figure. The transfer function H(s) is


Sign in to see the solution
Log in to view the explanation, track your attempts, and keep your progress.
Sign in to UnlockA system has poles at 0.01 Hz, 1 Hz and 80 Hz; zeros at 5 Hz, 100 Hz and 200 Hz. The approximate phase of the system response at 20 Hz is
Sign in to see the solution
Log in to view the explanation, track your attempts, and keep your progress.
Sign in to UnlockFigure shows the Nyquist plot of the open-loop transfer function of a system. If has one right hand pole, the closed loop system is

Sign in to see the solution
Log in to view the explanation, track your attempts, and keep your progress.
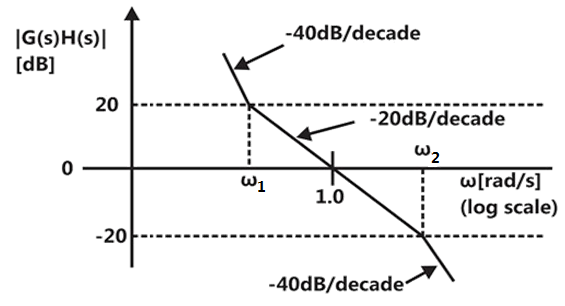
Sign in to UnlockThe approximate Bode magnitude plot of a minimum-phase system is shown in figure. The transfer function of the system is


Sign in to see the solution
Log in to view the explanation, track your attempts, and keep your progress.
Sign in to UnlockThe gain margin and the phase margin of a feedback system with are

0 dB,


88.5 dB,
Sign in to see the solution
Log in to view the explanation, track your attempts, and keep your progress.
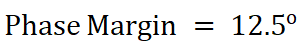
Sign in to UnlockThe phase margin of a system with the open-loop transfer function is

Sign in to see the solution
Log in to view the explanation, track your attempts, and keep your progress.
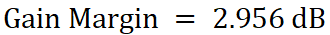
Sign in to UnlockThe system with the open loop transfer function has a gain margin of

Sign in to see the solution
Log in to view the explanation, track your attempts, and keep your progress.
Sign in to UnlockThe Nyquist plot of an all-pole second order open-loop system is shown in Figure. Obtain the transfer function of the system.
Sign in to see the solution
Log in to view the explanation, track your attempts, and keep your progress.
Sign in to UnlockThe Nyquist plot for the open-loop transfer function G(s) of a unity negative feedback system is shown in Figure. if G(s) has no pole in the right half of s-plane, the number of roots of the system characteristic equation in the right half of s-plane is
Sign in to see the solution
Log in to view the explanation, track your attempts, and keep your progress.
Sign in to UnlockThe gain margin (in dB) of a system having the loop transfer function is

0
3
6

Sign in to see the solution
Log in to view the explanation, track your attempts, and keep your progress.
Sign in to UnlockThe phase margin (in degrees) of a system having the loop transfer function is


Sign in to see the solution
Log in to view the explanation, track your attempts, and keep your progress.
Sign in to UnlockThe asymptotic Bode plot of the minimum phase open-loop transfer function in as shown in Figure. Obtain the transfer function

Sign in to see the solution
Log in to view the explanation, track your attempts, and keep your progress.
Sign in to UnlockConsider a feedback system with the open-loop transfer function, given by

Find the stability of the closed loop system using Nyquist stability theory.
Sign in to see the solution
Log in to view the explanation, track your attempts, and keep your progress.
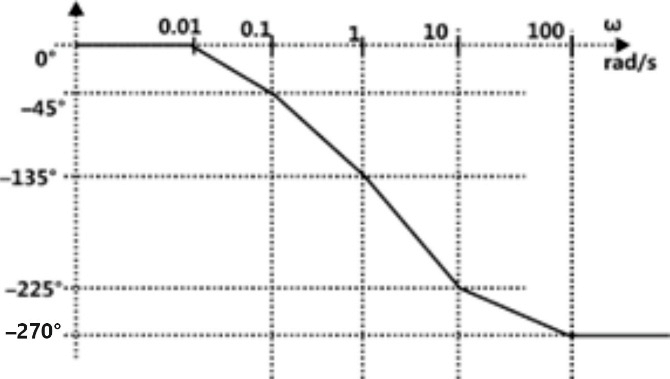
Sign in to UnlockIn the Bode-plot of a unity feedback control system, the value of phase of at the gain cross over frequency is. The phase margin of the system is


Sign in to see the solution
Log in to view the explanation, track your attempts, and keep your progress.
Sign in to UnlockThe Nyquist plot of a phase transfer function of a system encloses the point. The gain margin of the system is.


Sign in to see the solution
Log in to view the explanation, track your attempts, and keep your progress.
Sign in to UnlockThe loop transfer function of a single loop control system is given by

Using the Nyquist criterion, the condition for the closed-loop system to be stable is T< K. Find the values of K.
Sign in to see the solution
Log in to view the explanation, track your attempts, and keep your progress.
Sign in to UnlockNon-minimum phase transfer function is defined as the transfer function
Sign in to see the solution
Log in to view the explanation, track your attempts, and keep your progress.
Sign in to UnlockThe 3-dB bandwidth of a typical second-order system with the transfer function is given by


Sign in to see the solution
Log in to view the explanation, track your attempts, and keep your progress.
Sign in to UnlockThe open loop frequency response of a system at two particular frequencies are given by: and . The closed loop unity feedback control is then _________.


Sign in to see the solution
Log in to view the explanation, track your attempts, and keep your progress.
Sign in to UnlockThe poles of a continuous-time oscillator are pure imaginary. ( True=1, False=0)
Sign in to see the solution
Log in to view the explanation, track your attempts, and keep your progress.
Sign in to UnlockBode plot of a stable system is shown in figure. The transfer function of the system is ______.


Sign in to see the solution
Log in to view the explanation, track your attempts, and keep your progress.
Sign in to UnlockA unity feedback system has open loop transfer function.

Nyquist Plot
Nyquist Plot
Sign in to see the solution
Log in to view the explanation, track your attempts, and keep your progress.
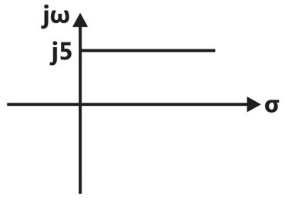
Sign in to UnlockThe pole-zero pattern of a certain filter is shown in the figure below. The filter must be of the following type.
Sign in to see the solution
Log in to view the explanation, track your attempts, and keep your progress.
Sign in to UnlockThe open loop transfer function of a feedback control system is: .

The gain margin of the system is:
Sign in to see the solution
Log in to view the explanation, track your attempts, and keep your progress.
Sign in to UnlockThe open loop transfer function of a feedback control system incorporating a dead time element is given by . Where , and are variable scalar parameters.


For a given value of T, find the value of k for which the closed-loop system is stable. is the smallest value of satisfying the equation


Sign in to see the solution
Log in to view the explanation, track your attempts, and keep your progress.
Sign in to Unlock